
Why cheap energy often just can't reach you
A couple of months ago, my friend Ljube and I went to Copenhagen to attend a hackathon thrown by Electricity Maps. The tool we built didn't win the hackathon, but the lovely folks at Electricity Maps must have thought it was pretty and/or useful enough, because they made up a prize just for us, after the fact. The prize was 6 months of free access to their paid API.
I also thought it was pretty and useful, so I wanted to show it to you all 🤓
I know what you're thinking.
What a beautiful piece of grid porn. But what the heck am I lookin' at?
At first glance, the map may look like a poor man's version of the well-known Electricity Maps view of energy prices. That remark is spot on, and this poor man obviously has a fantastic taste in color palettes.
If you look closer, however, you will notice little purple highlights sprinkled around the map. Let's try clicking on one of them – say, the line crossing from Germany into Austria:
Alright, so now we're at Electricity Maps' Day-Ahead prices meets Wizz Air's flight connection map and a purple smidge that kinda looks like Kylo Ren's lightsaber. Much clearer.
So here's the deal: yes, the map shows actual cleared day-ahead prices for each country in the Europe's Core region. The colors are meant to highlight the differences in the prices between countries.
The European power markets are coupled, which is to say that every country can freely trade with other countries, with the aim that we all get the cheapest possible energy. If the system works as intended, not only will we all get energy cheaply, but we will all also get it at the same price.
This does indeed happen sometimes, and it makes for boring maps like this one:
But why do equal prices for all only happen sometimes? Why isn't it always the case? That is exactly the question this tool was built to answer.
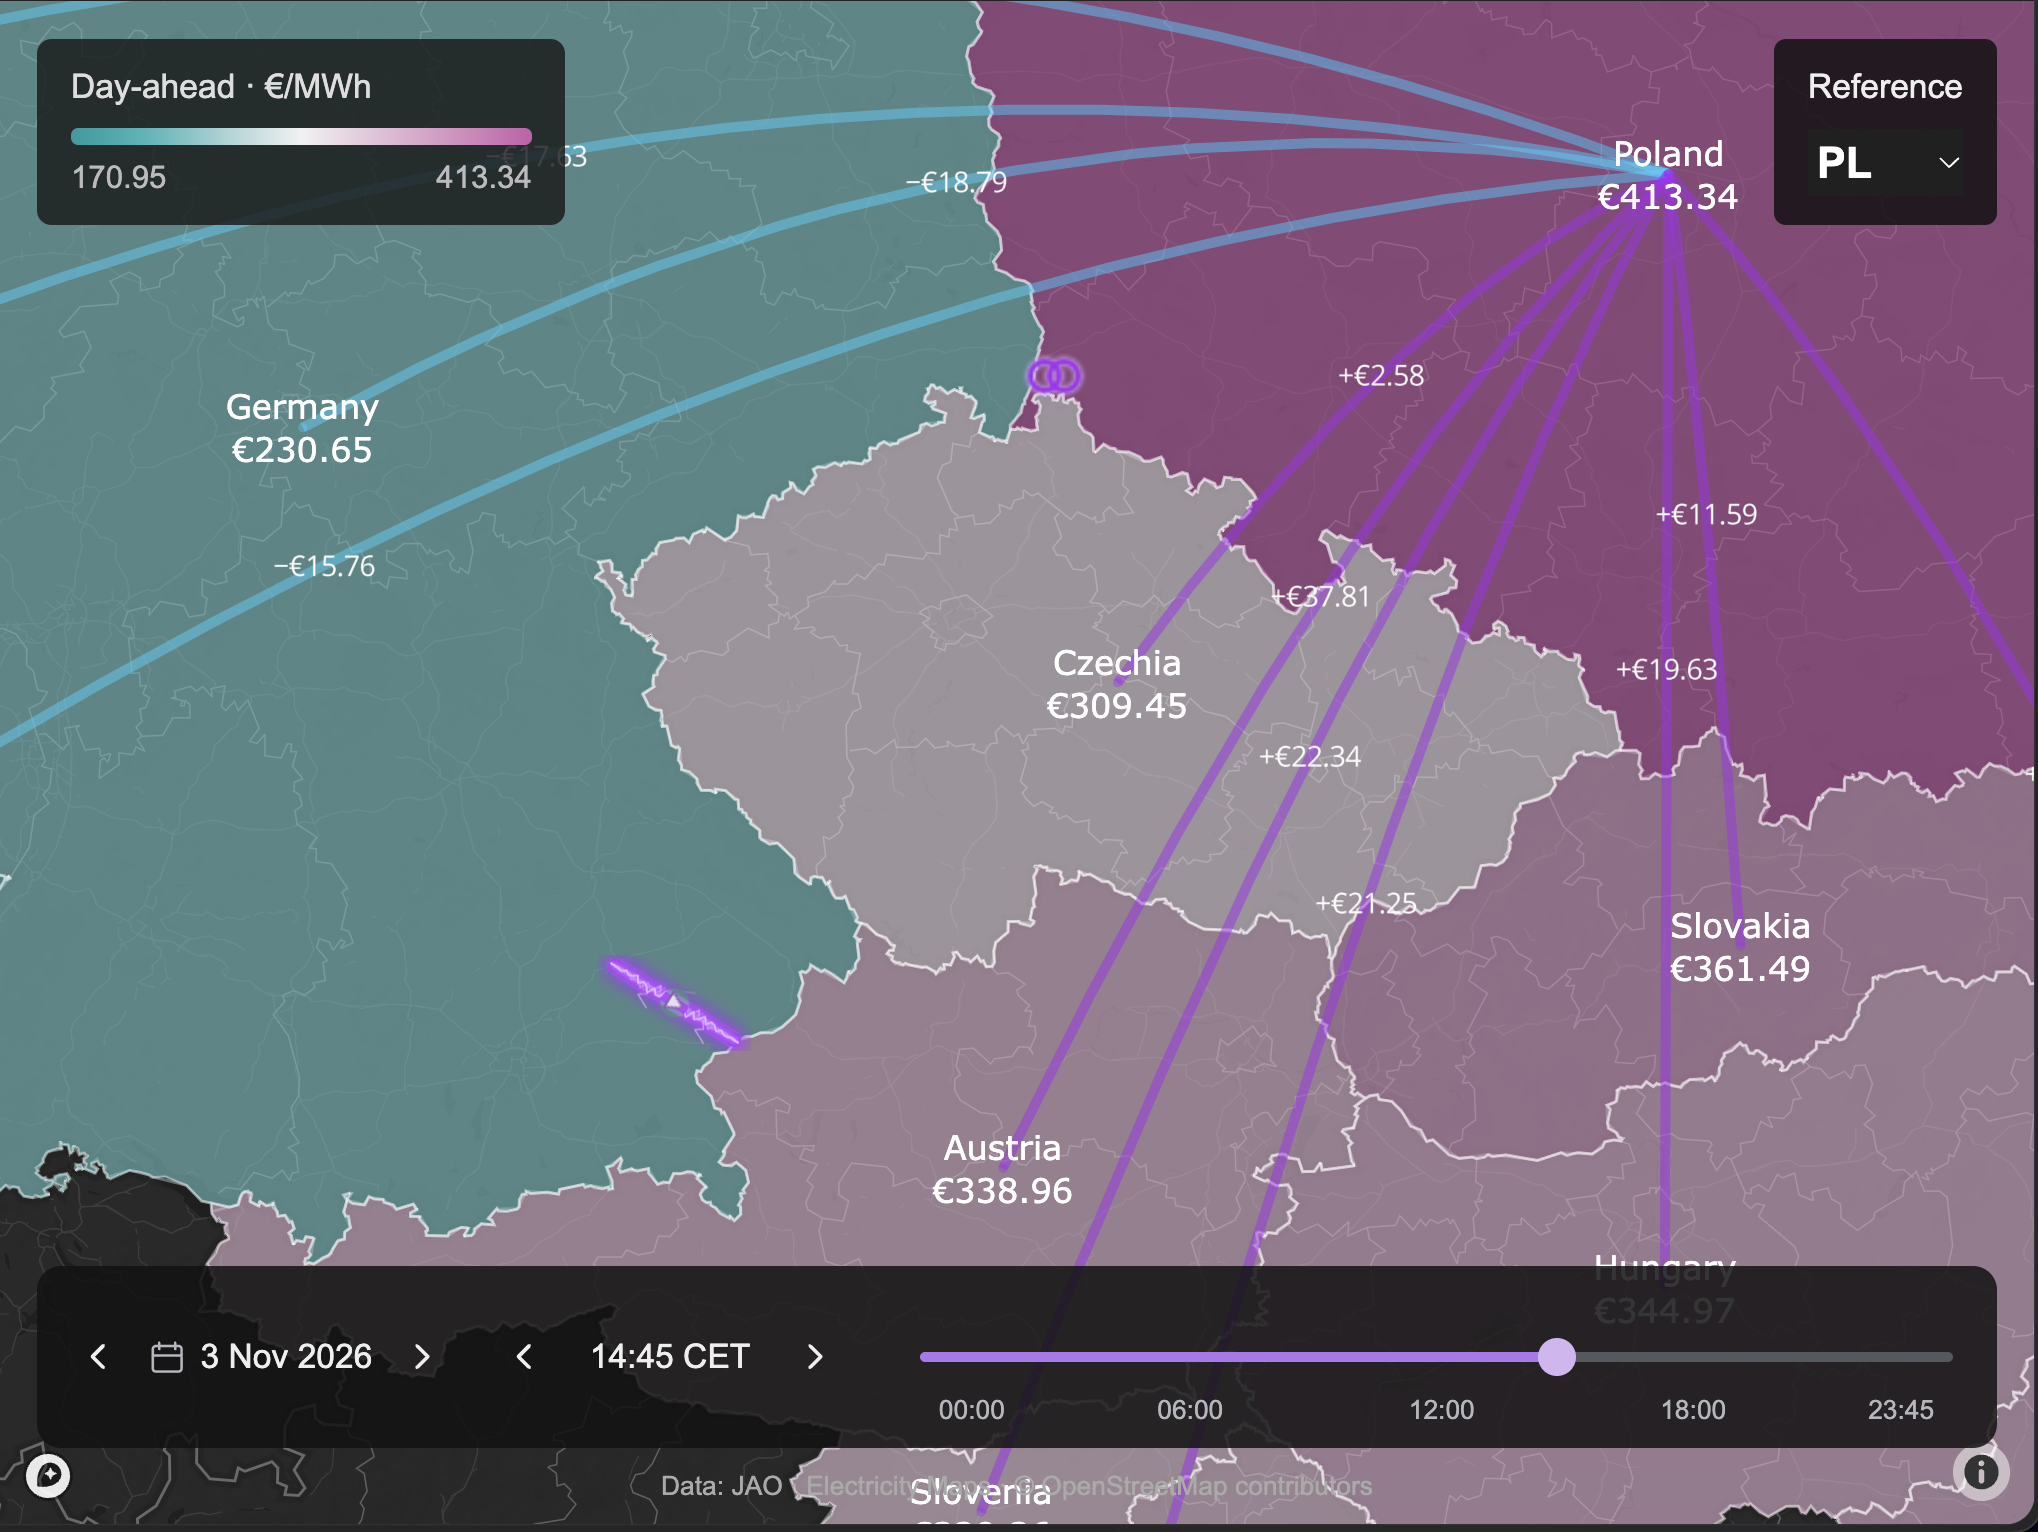
Coming back to our pretty map – it's showing that the cleared day-ahead prices for November 3rd at 14:45 landed at ~€217/MWh in France and ~€413/MWh in Poland.
It also highlights 4 little purple elements: 3 power lines and 1 transformer. Can you spot them? The fact that those lit up means that they maxed out their allowed capacity for the interval starting at 14:45.
In other words, even though there was still cheaper energy being offered in Western Europe, getting it across to Eastern Europe would have loaded these 4 elements beyond their allowed capacity, risking an outage on the grid. This is why these elements are called critical elements.
As a result, offers from more expensive generators in Eastern Europe had to get awarded in order to cover the expected demand, resulting in the high prices we see across Eastern Europe.
To really drive this home, let's look at an example. Clicking on the line between Germany and Austria shows how much that line being loaded contributes to the difference in price between Poland and all other countries.
For example, the teal ray between Poland and France is showing -€15.76. That is saying
Hitting the limit of the selected line is making prices in France €15.76 cheaper than in Poland.

Dude, 15 euros cheaper?! France is like 200 euros cheaper than Poland! What the heck does 15 have to do with it?!
Great question! The total spread between France and Poland is indeed almost 200 euros. However, clicking on any one critical element shows the contribution of that element to the price spread. All highlighted elements contribute to the price spread, so the ~€200 difference is split between them.
As you may expect, that transformer near the border between Germany and Poland might have a more significant contribution. Let's go ahead and click on it too!
Alright, now that same Poland-France ray is showing over 150 euros! Now we're talking. By now I'm sure you get the idea – clicking through all 4 critical elements and adding up their contributions will add up quite exactly to the total difference in the prices between France and Poland (and really any pair of countries you want to look at).
Is this real? 🔮
The prices shown are the actual cleared day-ahead prices of electricity, sourced from the Electricity Maps API (our Hackathon prize 🤓). The relative contributions are a simple product of the power transfer distribution factors (PTDFs) and shadow prices for the critical elements as published by the JAO Core Publication Tool.
I didn't get to explain how all of this works as simply as I usually like to on this website, but I'm hoping that there will also be those in the audience who are deep enough into energy markets to find this tool useful.
Either way, I invite you to click around in the tool and try it for yourself. The full-screen version is available here:
The tool is fully open source and available at the following repository:

The repository includes an agentic harness with an LLM Wiki. That means if you ask your favourite LLM to look at it, the LLM will find it particularly easy to make sense of it and it will be able to explain to you how it all works.
If you're like me though, and still like to talk to humans every once in a while, ask your questions or post your comments about this post on this LinkedIn thread instead 🙌